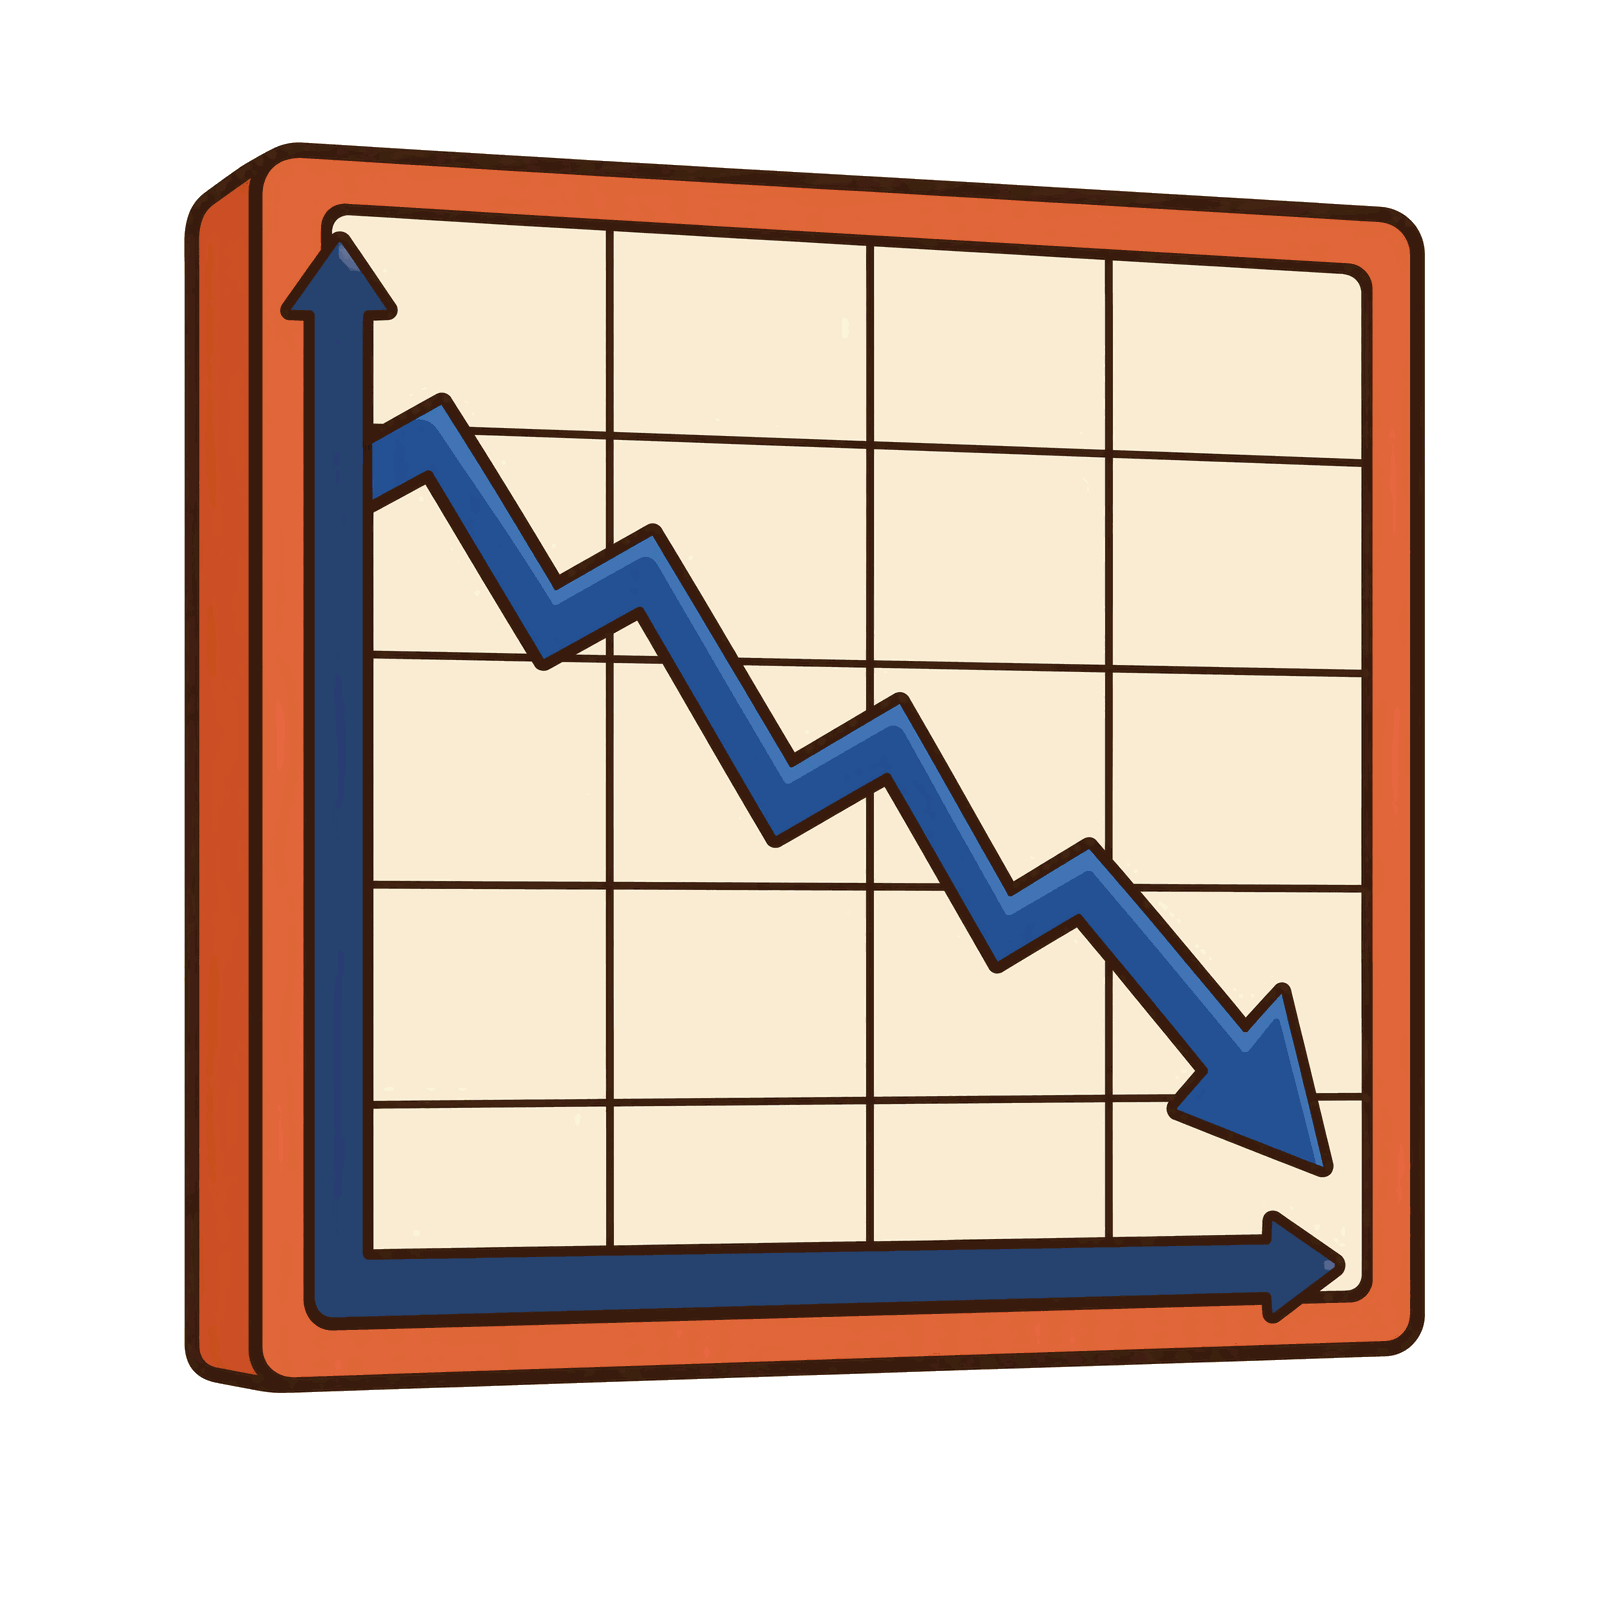
Falling chart
A blue arrow bending downward. For index declines, falling exports and price corrections; in Korean market convention blue marks a fall.
- Format
- Transparent PNG
- Size
- 1600 × 1600 px
- Background
- None. Sits on any colour without a white box
- Licence
- Commercial use permitted with attribution. Reselling the file is not
- File size
- 74 KB
- Palette
- #FEF3D9#E0D1B9#BB562F#8E8F91#36324A Sampled from the original file, for matching type and background to the artwork.
Please credit Dotori Economy and link back to this page. That link is what keeps the collection growing, and it is the only thing asked in return.
- falling chart
- downtrend
- decline arrow
- market correction
A falling line is still a line.Same ink, same gridlines.Only the reader's face changes.
Where it works
- Lead image and inline art for a blog post or newsletter
- Background element in a card or social graphic
- Icons and cover art in reports and slide decks
- Transparent background means it drops straight onto a coloured slide